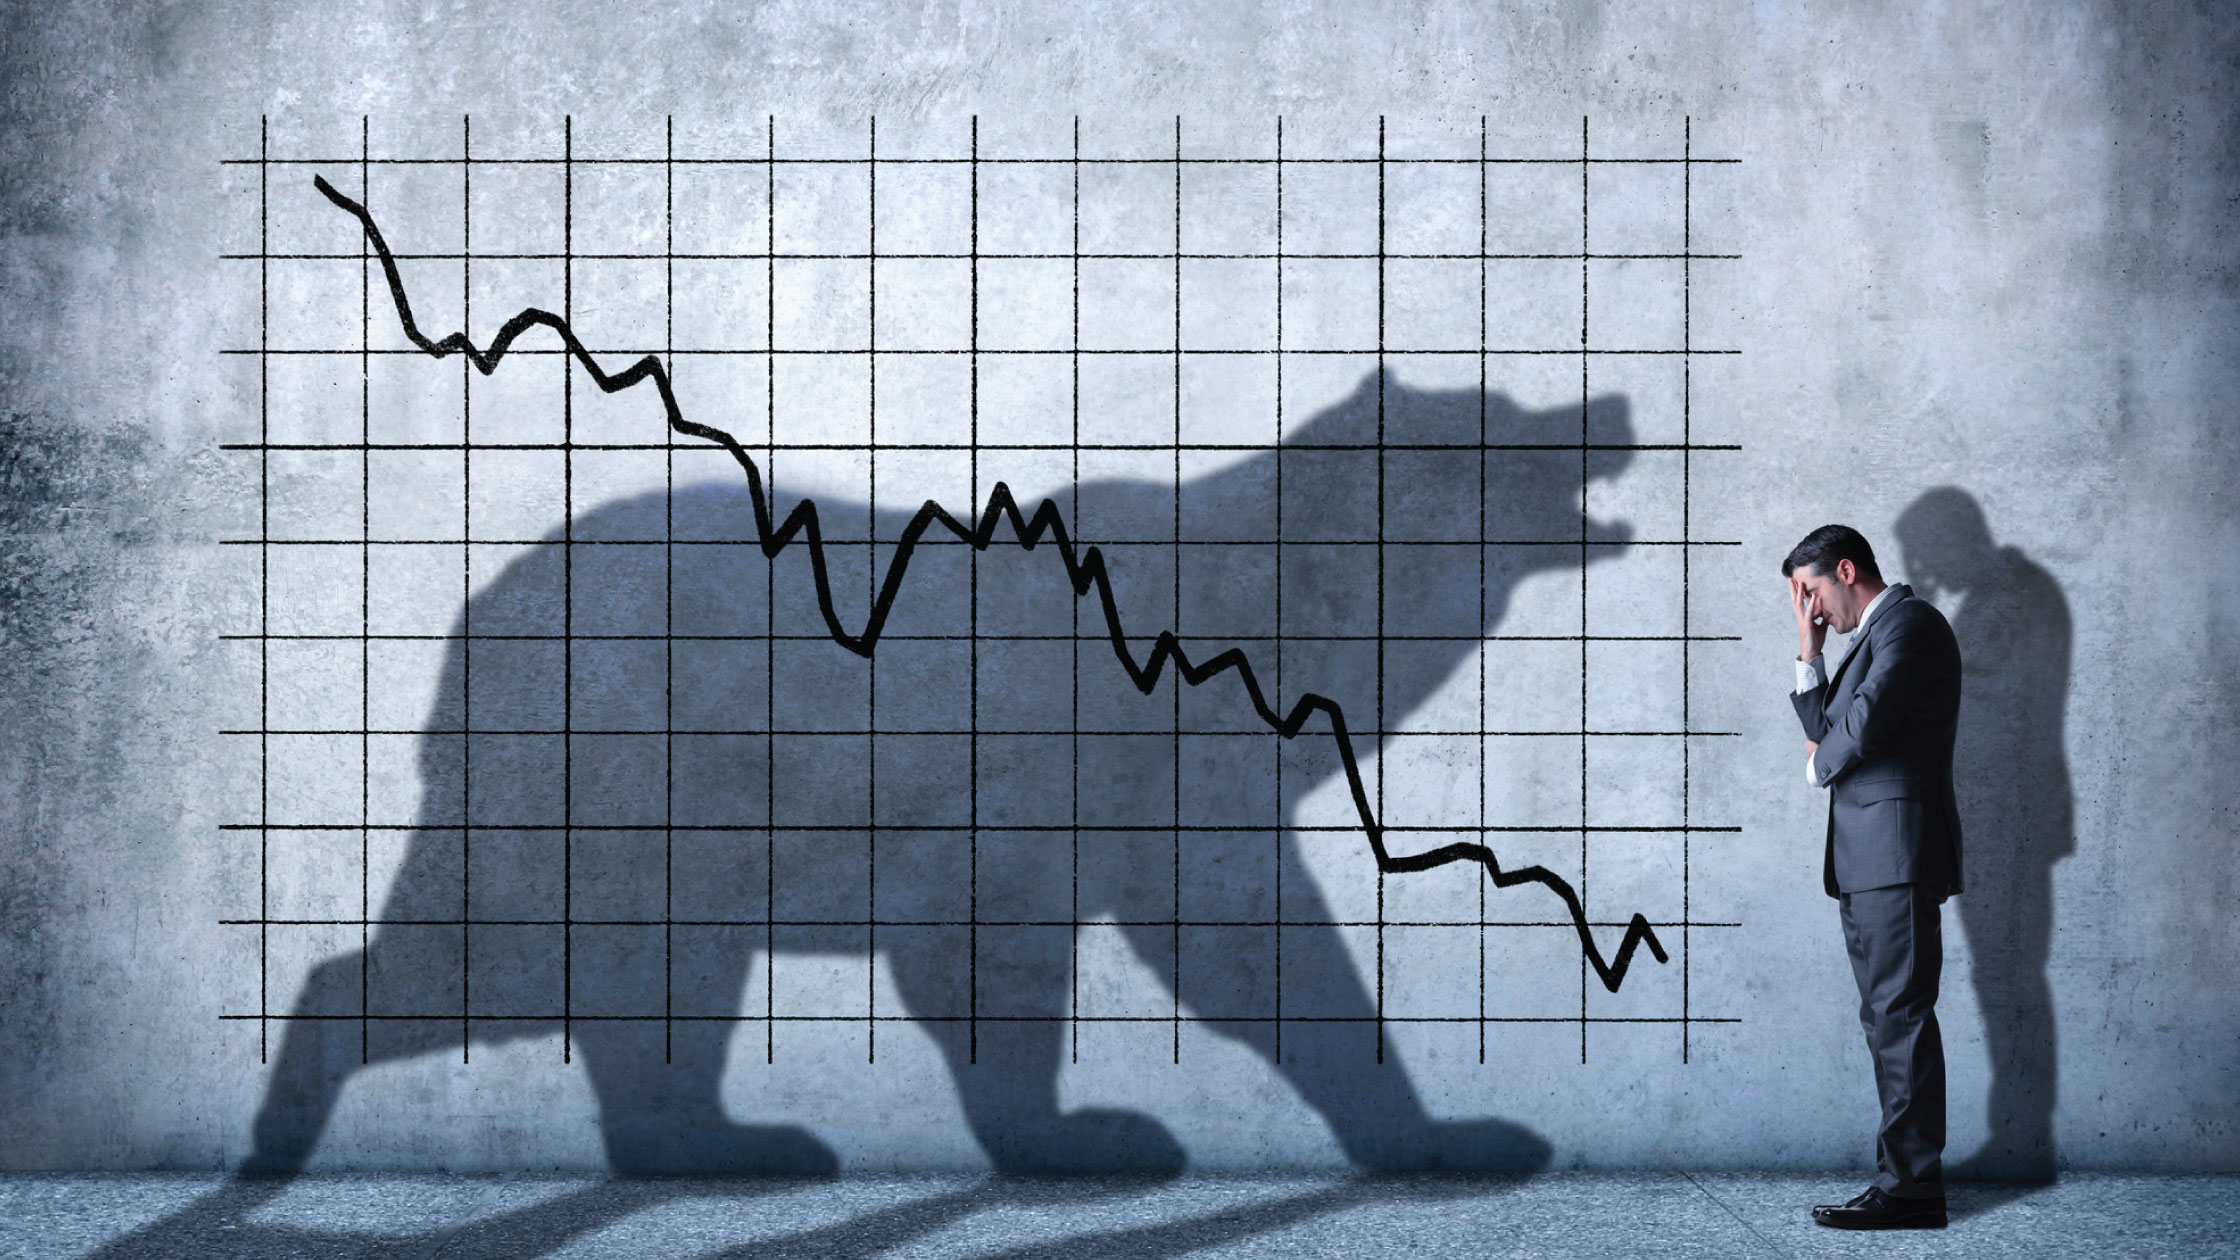
In the US, the S&P 500 Index is hovering near the edge of a bear market after falling by more than 18% from its recent high.
A bear market means the stock market has fallen by more than 20% from its recent highs.
Meanwhile, the tech-heavy Nasdaq 100Index is already deep in a bear market after it’s fallen by close to 30% from its recent peak.
Our Chief Investment Strategist, Say Boon, has written on the recession risk in the US and pointed out that the average downside of a recession for the stock market comes in at around 40% over the last five decades.
This indicates that there’s more downside to the S&P 500 Index in the event of a recession.
Valuation is cheap
However, with the decline of close to 20% from its recent high, the S&P 500 Index is actually trading at a fairly attractive level.
Using the forward 12-month price-to-earnings (PE) ratio as an indicator, the S&P 500 is currently trading below its 10-year average.
As mentioned in my previous article, it is still not at a “screaming buy” level, especially considering the risks that are on the horizon.
A recession could lead to further losses in the US stock market.
However, it is premature to expect a recession for certain at this juncture given the strong US labour market at the moment.
The US Federal Reserve (Fed) chairman, Jerome Powell, has repeated his commitment over the past few weeks to get inflation closer to the Fed’s 2% target even if it comes at the expense of a 3.6% unemployment rate.
This is as the US labour market is at its strongest level since the late 1960s.
Think long term
The opportunity to buy companies with strong track records at a discount is appealing even if it comes at a cost of near-term losses.
The volatility in the stock market isn’t going away any time soon but a valuation at this current level points to a better buying opportunity in the stock market than where we were six months ago.
For example, Microsoft Corporation (NASDAQ: MSFT) is trading at a trailing PE ratio of 26.5 times, which is at a 22.8% discount from its five-year average.
Similarly, Visa Inc (NYSE: V) is trading at a discount of 16.1% and 14% in its trailing and forward PE respectively, as compared to its five-year average.

Disclaimer: ProsperUs Investment Coach Billy Toh doesn’t own shares of any companies mentioned.


