Peak hawkishness?
Hope springs eternal for investors as well as stock markets. So, when the S&P 500 Index “gapped-up” on the charts on Tuesday 4 October, some in the market returned to the Fed “pivot” theme.
Some even referred to the Reserve Bank of Australia’s (RBA) 25-basis point (bp) rate hike – the market was expecting 50 bps – on the same day as the catalyst.
It was, some pundits breathlessly suggested, a signal that central banks were retreating from rate hiking.
But to me, it was just another technical move within a broader downtrend, triggered by the 14-day RSI falling below 30, a level regarded as technically oversold.
But these oversold (or near oversold) reversals are metaphorically a dime-a-dozen.
If you bought every time (and this is the 7th time since the start of the year) the 14-day RSI approximated or fell below 30 for the year-to-date, you would have been beaten down again and again by the downtrend.
If you bought on the only other time that it dipped below 30 – that was in January this year – you would have been the poorer, in 1-month, 2-month, and 3-month terms (see below).
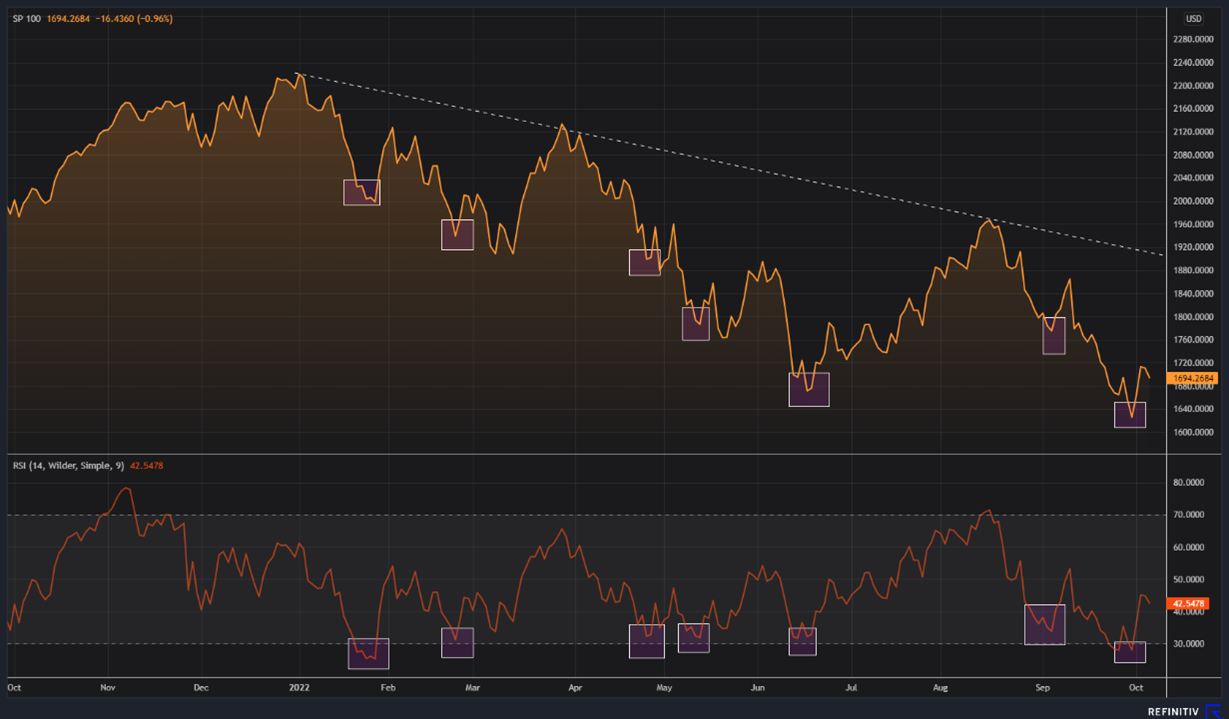 Sources: CGS-CIMB Research, Refinitiv
The S&P 500 ended the week up 1.5%. But the loss of momentum after the initial big move up on 4 October suggests the index will likely – as I had been suggesting – eventually break back below the June low of 3,636.
The Fed Funds futures market didn’t buy the pivot story
Although there might have been a suggestion of a Fed pivot in the equities market, the metaphorical memo didn’t get to the Fed Funds futures market.
The central view there remains a 75-bp hike next month, and another 50-bp hike in December.
Meanwhile, US jobs data again appeared to support our argument that there is no reason for the Fed to back off from rate hikes at this stage of the cycle.
Inflation is running at four decade-plus highs and jobs are still going a begging for takers. Why would the Fed back off now?
Employment records being broken
Non-farm payrolls pushed yet higher in September, adding another 263,000 jobs. August was already an all-time high – surpassing the pre-pandemic peak – but this takes it to a new record.
The market was expecting only 255,000. Meanwhile, unemployment dipped back to the cycle low of 3.5% in September, from 3.7% in August. The market was expecting 3.7%.
US job openings declined, from 11.2 million in July to 10.1 million in August, giving some hope that the heat might come out of the labour market.
But take this in recent historical context: There were only 7.2 million job openings in January 2020.
Meanwhile, the labour participation rate went down again to 62.3% in September, from 62.4% in August.
And average hourly earnings went up from 0.28% month-on-month (m/m) in August to 0.31% m/m in September.
Because of base year effects, it went down from 5.2% year-on-year (y/y) in August to 5.0% y/y in September.
So, even with that easing, the earnings growth rate thus far remains within the recent range of 4.9% y/y to 5.6% y/y.
And the Atlanta Fed’s wage tracker shows wages growth remains at the series’ highest level of 6.7% y/y in August.
US inflation – prepare for more bad news
For this week, consumer price inflation (CPI) will come back into focus, with the September data due on Thursday 13 October.
The good news of a slight easing in the headline (all-items) rate from 8.3% y/y in August, to around 8.1-8.2%, is likely already fully priced. The market consensus is for 8.1% y/y.
The bad news could come from core CPI, which has been on the rise from 5.9% y/y in July to 6.3% y/y in August.
The core figure could tick yet higher to around 6.5%-6.6% y/y, pushing out further any real hope of a Fed pivot.
Meanwhile, another threat to price stability has emerged on the energy front.
Crude oil prices staged a powerful rebound last week, on news that OPEC+ will cut its production target by 2 million barrels per day.
That sent Brent crude up 15.3% last week and West Texas Intermediate (WTI) up 16.9%.
If that is sustained, the flow-through to higher US gasoline prices could push headline inflation back up even as the Fed struggles with core inflation.
US equities bear market is far from over
There is an interesting symmetry between the S&P 500’s moves from the start of the bear market in January this year to the present and the period October 2007 to June 2008.
The latter was an earlier (deep) bear market. History doesn’t have to repeat itself but the pattern of the decline so far looks worryingly similar (see below).
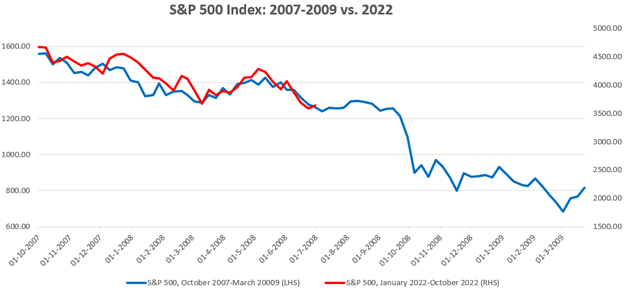 Sources: CGS-CIMB Research, Refinitiv