Bear Market Rally in Stocks Could Continue But Buyers Beware
October 31, 2022

Technical rebound in stocks could continue into December
US equities could continue higher in the coming weeks on the technical rebound that we had been writing about.
The S&P 500 Index picked up almost 4% last week, on the rebound off the 50% retracement of the bull market from March 2020 to January 2022.
The technical oscillators on the weekly chart suggest this rebound could continue, aided by the US Mid-Term Election effect.
Another narrative supporting this countertrend rally is talk of a Fed “pivot”.
But this is likely to be another countertrend rally within a broader bear market, and we have seen quite a few already, all of which ended with lower lows.
The S&P 500 can rebound to around 4,150 and still stay within the bounds of its downtrend channel, before heading back lower (see chart below).

Source: Refinitiv
Talk of Fed pivot likely driven by lower inflation expectations
Core inflation continues to rise as last week’s US core PCE inflation data showed. PCE inflation was unchanged for September at 6.2% year-on-year (y/y).
But core PCE inflation pushed yet higher, from 4.9% y/y in August to 5.1% in September.
Meanwhile, the gasoline/crude oil crack spread – which typically leads US gasoline prices – has been moving higher since September.
If continued, this should push US gasoline prices higher, putting at risk the tentative decline in the headline inflation rates.
So, in looking for hope for a Fed “pivot”, the market is likely to focus on inflation expectations, which are down across three indicators:
- The Cleveland Fed’s model estimate of 1-year inflation expectations;
- The New York Fed’s survey of 1-year inflation expectations, and;
- The University of Michigan’s survey of 12-month inflation expectations
But S&P 500 earnings growth has faded
On the earnings front, S&P 500 profit margins appear to be continuing to decline.
According to Factset, “the (blended) net profit margin for the S&P 500 for Q3 2022 is 12.0%, which is below the previous quarter’s net profit margin and below the year-ago net profit margin.”
“If 12.0% is the actual net profit margin for the quarter, it will mark the fifth straight quarter in which the net profit margin for the index has declined quarter-over-quarter” (see chart below).

Sources: CGS-CIMB Research, Factset
Factset also reported that the blended earnings growth for Q3 2022 was 2.2%. If this turns out to be the actual growth rate, it would be the worst performance since Q3 2020.
And stripping out energy companies, the S&P 500 Index would be reporting a 5.1% decline instead of 2.2% growth.
What is striking is that despite the likelihood of five consecutive quarters of margin contraction, analysts are still expecting a reversal in margins back up in Q4 continuing into 2023, despite a gradually weakening economy.
My view had been that the 8% earnings growth for 2023 expected by analysts for the S&P 500 was unrealistic.
And indeed, the decline in S&P 500 profit margins over the past five quarters is consistent with the decline in y/y earnings growth in US corporate profits from Q2 of last year (see chart below).

Sources: CGS-CIMB Research, Federal Reserve Bank of St Louis
In China, earnings estimates are moving higher
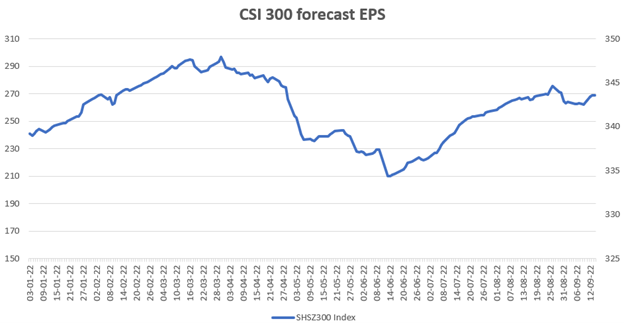
The recent selling of Chinese equities runs counter to the rising index earnings estimates for the CSI 300 (see chart below).
 Sources: CGS-CIMB Research, Bloomberg
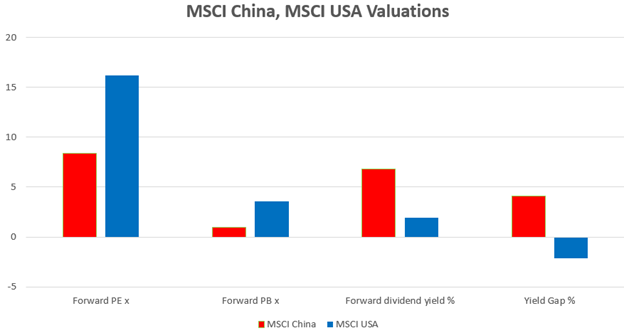
On valuations, the MSCI China is now trading at a forward price-to-earnings (PE) ratio of 8.4x, about half the level of 16.2x for the MSCI USA.
On price-to-book (PB) ratios, MSCI China is 0.97x, less than a third of the 3.6x for MSCI USA.
MSCI China’s forward dividend yield is currently at 6.8%, providing a positive yield gap of 4.1% over the 10-year China government bond yield.
MSCI USA’s dividend yield is around 1.9%, giving it a negative yield gap of -2.1% against the 10-year UST yield.
With US earnings estimates likely to come down as Chinese equities earnings estimates move up, there is likely soon to be a point at which investors will start questioning the logic of the recent negativity towards Chinese stocks (see chart below).
 Sources: CGS-CIMB Research, Bloomberg, MSCI
Say Boon Lim
Say Boon Lim is CGS-CIMB's Melbourne-based Chief Investment Strategist. Over his 40-year career, he has worked in financial media, and banking and finance. Among other things, he has served as Chief Investment Officer for DBS Bank and Chief Investment Strategist for Standard Chartered Bank.
Say Boon has two passions - markets and martial arts. He has trained in Wing Chun Kung Fu and holds black belts in Shitoryu Karate and Shukokai Karate. Oh, and he loves a beer!


