Textbook technical rebound
Technicals, programme trading, and short covering combined to send the S&P 500 on a roller coaster ride last week, eventually ending with the index down 1.6%.
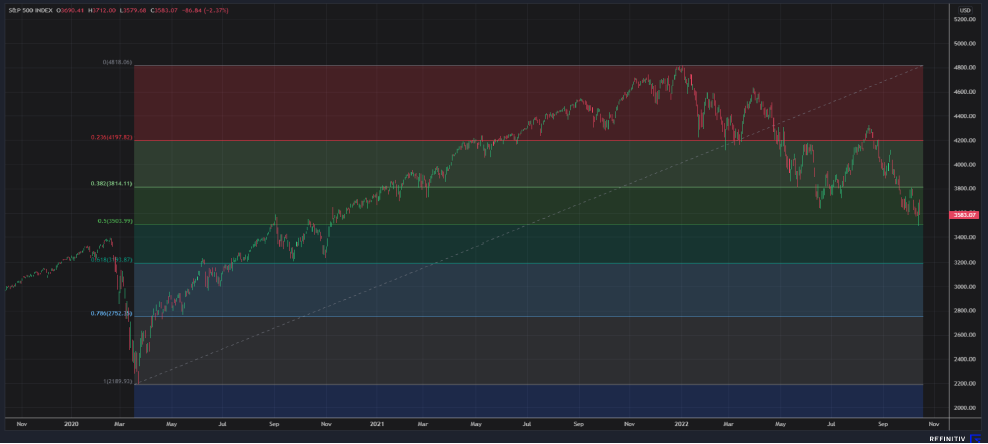
Notably, the S&P 500 bounced – as if off a trampoline – as it pushed just below the 3500 round number psychological support level, which also coincides with the 50% Fibonacci retracement of the entire move from March 2020 to January 2022 (figure 1). And that also coincided with oversold oscillator signals from two weeks ago. It was a textbook technical rebound. But textbook doesn’t mean sustainable.
 Source: CGS-CIMB Research, Refinitiv
Inflation data shook the market (again)
The September US CPI inflation data played out much as we expected but it was not what the market wanted to hear. Last week, I wrote: “A slight easing in the headline (all-items) rate from 8.3% y/y in August, to around 8.1%-8.2%, is likely already fully priced. The market consensus is for 8.1% y/y. The bad news could come from core CPI inflation, which has been on the rise from 5.9% y/y in July to 6.3% y/y in August. The core figure could tick yet higher to around 6.5%-6.6% y/y, pushing out further any real hope of a Fed pivot.”
As it turned out, the data showed a y/y headline inflation figure of 8.2% y/y for September. Although it was a slight easing from 8.3%, the market expected 8.1%. And as I warned last week, the bad news did come from core inflation, which went to 6.6% y/y, against the market expectation for 6.5% y/y.
And the core inflation data showed more price surges in September in shelter, services other than energy services, and even medical services. Inflation for shelter, which accounts for a third of CPI basket by weight, ticked up further from 6.3% y/y to 6.6% y/y. Services (ex-energy services) looked out of control, racing up from 6.1% y/y to 6.7% y/y. Medical services was another shocker, surging from 5.6% y/y to 6.5% y/y.
So, hopes for a “Fed pivot” evaporated
The Fed Funds futures market priced up the probability of a 75-basis points hike in November to 97%. Beyond that, the dominant trade on the Fed Funds futures market is now anticipating another 75-basis points in December, compared to 50-basis points only a week earlier. That’s 150-basis points in a 6-week interval.
Reality check on the dreadful fundamentals.
In the coming week, there will be no shortage of optimists who will be calling “buy-the-dip”. And indeed, the bounce at the 50% Fibonacci retracement could continue a few more weeks. But the dreadful fundamentals should at a minimum call for great caution. This is a market that is struggling with the worst inflation in more than four decades; the biggest gap between the headline inflation rate and the Fed Funds rate on record (that means the Fed is truly, uniquely behind the curve on this), the deepest negative real 10-year US Treasury yield in over 45 years; and massive overvaluation for both US stocks and bonds.
What do our favorite capitulation indicators tell us?
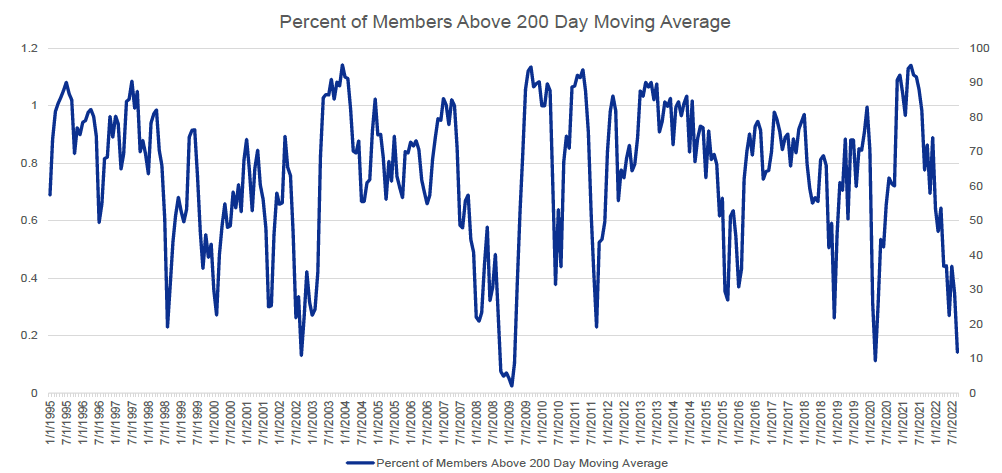
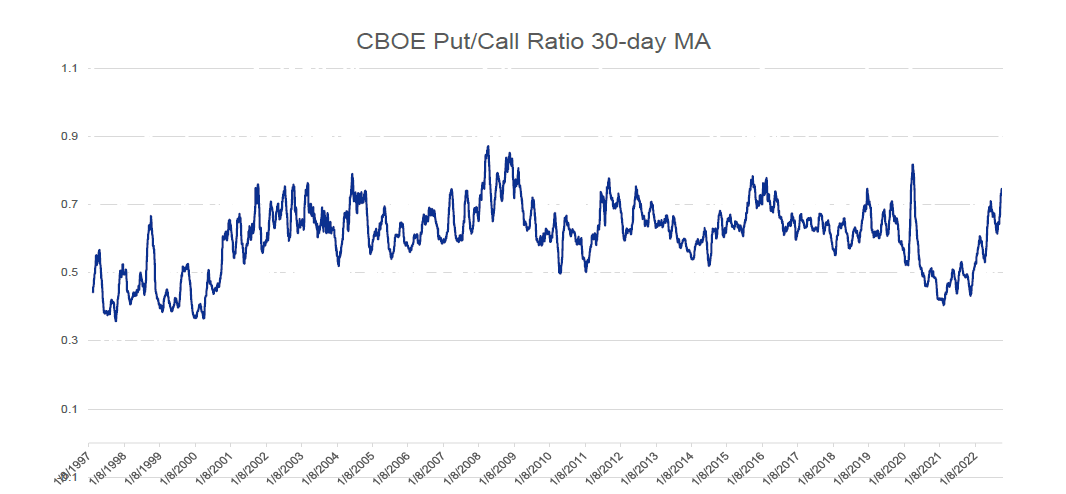
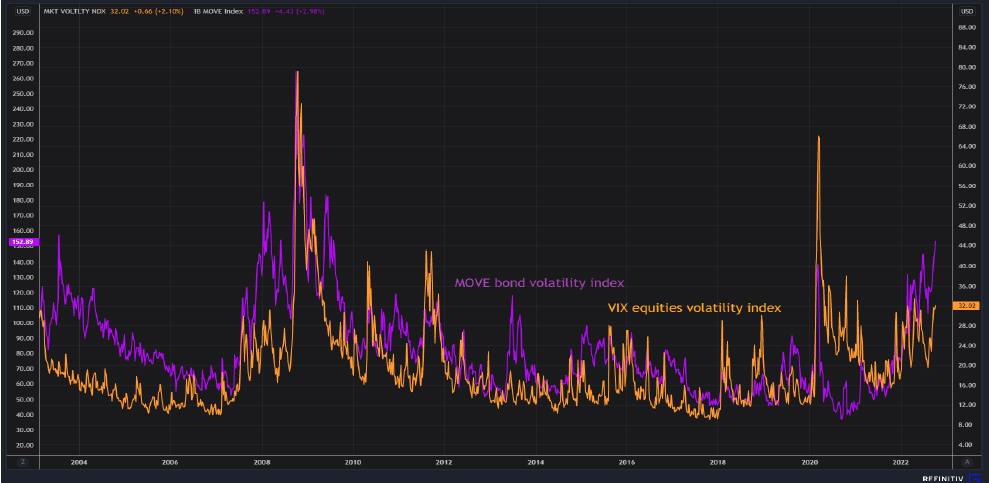
The percentage of S&P 500 stocks priced above their 200-day moving average is now at levels of previous cyclical lows when it hit 10% or less. But the 30-day moving average of the CBOE put/call ratio, around 0.74, is still below the peaks of around 0.8 to 0.9 at the bottom of cycles. Meanwhile, American retail investors are still very calm – arguably complacent. Stock allocation is well above what was seen at previous market bottoms. Indeed, the most recent 63.4% allocation is above the average of 62%. Equities volatility is still too low. It is also lagging bond volatility. Equities volatility should rise to match or even exceed bond volatility at the peak of fear (figures 2-4). The balance of indicators suggests to us this bear market is by no means over.
 Source: CGS-CIMB Research, Bloomberg
 Source: CGS-CIMB Research, Bloomberg
 Source: CGS-CIMB Research, Refinitiv
Watch the UK Gilts market this week
The Bank of England’s bond-buying programme expired end of last week. There is now extreme pressure on the BOE to extend this, given the likelihood that bond vigilantes will come out with metaphorical baseball bats when trading resumes on Monday, if the BOE doesn’t step back in. To recap, the 10-year Gilt has gone from 0.065% in August 2020 to 4.327% last Friday, as headline inflation surged from 0.2% in August 2020 to the latest 9.9%. This is the BOE’s dilemma: If it does nothing, the collapse of the market for Gilts could trigger defaults among UK pension funds which have long positions in UK government securities on margin finance. That could trigger a system-wide financial crisis. If it steps in again, it could find itself in an open-ended support scheme, much like the Bank of Japan’s yield curve control programme. Note the Bank of Japan now owns about half the total supply of Japanese Government Bonds. But Japan’s inflation rate is running at less than a third of the UK inflation rate. If the BOE goes into unlimited bond buying, it could be stoking inflation through monetary expansion at a time when it is raising rates to control inflation. How does that make any sense?