US Bear Market Likely to Continue While Chinese Stocks May Benefit
June 20, 2022

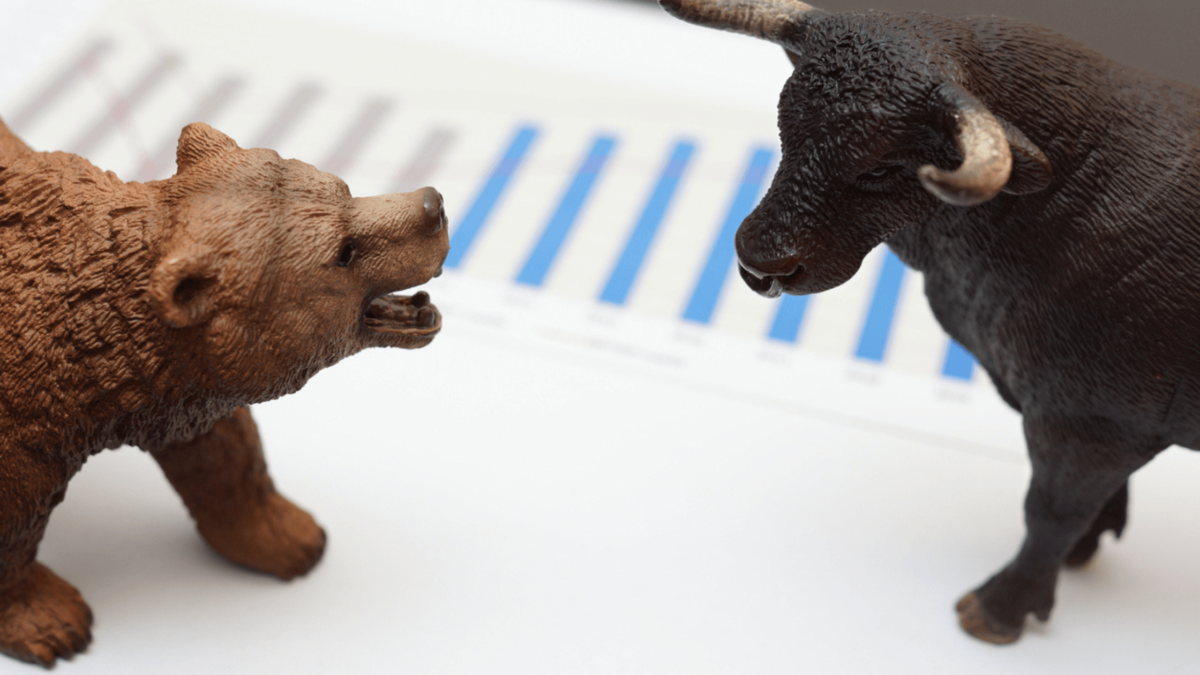
Unfortunately for investors there is no end in sight to the US bear market, despite the Friday rebound last week.
Indeed, if history is a useful guide, we may only be at the mid-point of the wash-out of US stock prices. Looking more broadly, the bear now also rules over the European and Japanese stock markets too.
However, in sharp contrast, Chinese equities are continuing their breakout above technical resistances, but more on that later.
Suffice to say, for now the two developments (confirmation of the bear market in the US and Chinese stocks breaking up above resistances) may actually be two sides of the same “coin”, so to speak.
That is, bearishness surrounding US stocks could be driving money into Chinese equities.
The bear statistics
The S&P 500 Index lost 5.8% last week, confirming the bear market that I called in May. The index closed the week almost 24% below its 4 January intra-day high.
Meanwhile, the Nasdaq 100 lost 4.8% last week, leaving it almost 33% below its November 2021 high.
The Eurostoxx 50 is also in the grip of the bear, down 22% from its November 2021 high. The Nikkei is down 16% from its September 2021 high.
But that relative outperformance in JPY terms has been on the back of a shocking decline in the value of Japanese Yen, from USD/JPY 115 at the start of the year to around 135 now.
In USD terms, the MSCI Japan is down almost 30% from its September 2021 high. So, in that regard, Japan is also in a bear market.
And the Japanese economy and market both face a potential financial crisis if the Bank of Japan cannot hold down the yield of the 10-Year Japanese Government Bond (JGB) in the face of rising government bond yields elsewhere in Developed Markets.
More Fed rate hikes to come
The big event last week was the Federal Open Market Committee (FOMC) decision to hike the Fed Funds Target Rate by 75 basis points to 1.5%-1.75%.
Along with that, the FOMC members’ median end-2022 projection for the (midpoint) Fed Funds Rate went up from 1.9% to 3.4%.
The median end-2023 projection went up from 2.8% to 3.8%. But note that the Federal Reserve (Fed) reckons 3.8% to be the peak. The FOMC then expects the appropriate rate to ease down to 3.4% by end-2024.
I am very sceptical of this. For starters, the current rate of 1.75% (at the upper bound) is still below the “neutral rate” estimated at around 2.0%.
So it is, in theory, still stimulatory, even while inflation is at a 40-year high. Then we go to the Taylor Rule model – a formula that economist John Taylor created to guide the Fed on what an appropriate policy rate should be given any output gap and inflation situation.
The outcomes will be different, given varying sets of assumptions. But it is worth noting the outcomes of a few credible sets of assumptions, as follows.
The Atlanta Federal Reserve has a Taylor Rule Utility, with three different methodologies, and the outcomes for the appropriate policy rate range from 5.6% to 7.2%.
Another methodology and set of assumptions published by the Federal Reserve Bank of St Louis suggested a Taylor Rule rate of 10.6%.
Never mind the more extreme outcomes – even 5.4% will likely be catastrophic for the US economy and markets.
Fed is unrealistically optimistic
To find a headline inflation rate this high (on the rise), we have to go back to September 1978 when headline CPI was 8.5%.
The Fed Funds Effective Rate then was also 8.5%. Never mind, let’s consider the late 1970s an extreme outlier, and leave it to one side.
More recently, we saw headline inflation peak at 4.7% in 2005. That required a peak Fed rate of 5.2% for a whole year, before inflation eventually came down.
And by the way, that also triggered a recession. You may remember the eventual collapse of subprime mortgages, CDOs and Lehman Brothers following that.
US stocks face risk of more downside ahead
According to independent research house TS Lombard, the average US bear market since 1929 lasted 17 months and saw an average drawdown of 40%. So far, the S&P 500 has only lost 24%.
A look at the cyclical bottoms in previous recent bear markets is sobering. After last week’s sell-off, the S&P 500 forward price-to-earnings (PE) ratio came down to 16.3x.
That is based on US$225 index earnings. At the bottom of the March 2020 bear market – the shortest bear market in history – the S&P 500 forward PE ratio fell to 14.2x.
On the basis of that mild forward PE contraction, we would be looking at an S&P 500 level of around 3,200.
And that, by the way, that only takes the market down by around 34% (still less than the post-1929 average decline). We won’t even contemplate the 2008-2009 cycle low forward PE of around 11x.
And there are no strong signs of capitulation at the moment either.
One much talked about indicator – the percentage of S&P 500 stocks that are trading above their 50-day moving average – is too “noisy” to be a useful indicator of major turning points.
For example, during the Global Financial Crisis, that indicator (using the current level) could have been read as signalling to buy all the way from early 2008, with painful consequences.
A less “noisy” indicator – the percentage of S&P 500 stocks that are trading above their 200-day moving average – is telling us we are still quite some distance from the levels of fear that typically signal a final capitulation is near.
Chinese equities continue to be a positive outlier
In last week’s Big Money, I suggested that Chinese equities were on the brink of a breakout above technical resistances, just as US stocks were breaking down.
Well, the technical breakdown in US equities has just confirmed the bear market. Meanwhile, the breakout of Chinese stocks above technical resistances continues.
The CSI 300’s breakout above its “Ichimoku Cloud” resistance that we said was in progress is now complete (see chart below).

Now, it is testing its 100-day moving average. Watch this space, as it often takes a few attempts before even a bullish index breaks above this resistance.
But for the CSI 300, breaks above the 100-day moving average have a tendency to be followed by quite substantial periods of gains (see below).

Opposite ends of the policy cycle
At the heart of this may be the policy tightening in the US, the looming consequent recession, and the search for alternatives to US assets – stocks, Treasuries and corporate credits.
China’s recent commitments to fiscal and monetary stimulus are a welcome counterpoint to the falling monetary aggregates, surging rates and yields, and fiscal consolidation in the US.
Essentially, China is now easing as the US is tightening. There had been a raft of stimulus announcements from Chinese policy makers over recent months.
But because of their piecemeal nature – released progressively over time rather than as a “big bang” statement – the market seems to have paid relatively little attention to them.
Yet it’s mounting up and the market is starting to sit up and take notice. As I wrote in last week’s Big Money, and it is worth repeating, Bloomberg recently estimated the value of Chinese policy makers’ fiscal and monetary policy commitments.
For the year-to-date it’s at a combined CNY 35.5 trillion (US$5.3 trillion), compared to CNY 30.7 trillion for 2021. As a year-to-date total, it is already closing in on the CNY 37.5 trillion for the whole of 2020.
Similarly, China’s modest path of rate cuts – 15 basis points off the one-year Loan Prime Rate (LPR) over the last six months, and 130 basis points off the Reserve Requirement Ratio over the past 12 months – have been ignored by a market that had become used to big policy moves in the US.
But as we are seeing now in the US, big policy moves cut both ways, with markets now rattled by big Fed policy rate hikes.
As a result of its cautious approach, the People’s Bank of China (PBOC) still has 8.1% in its RRR (the US is at zero, even as the Treasury 10-Year minus 2-Year spread warns of recession ahead).
Also, the PBOC still has 3.7% in the 1-year LPR. What appears to have finally sunk in with investors now is the big picture.
And that is that China still has considerable policy ammunition and is at the start of an easing cycle while the US is at the start of a tightening cycle.
Say Boon Lim
Say Boon Lim is CGS-CIMB's Melbourne-based Chief Investment Strategist. Over his 40-year career, he has worked in financial media, and banking and finance. Among other things, he has served as Chief Investment Officer for DBS Bank and Chief Investment Strategist for Standard Chartered Bank.
Say Boon has two passions - markets and martial arts. He has trained in Wing Chun Kung Fu and holds black belts in Shitoryu Karate and Shukokai Karate. Oh, and he loves a beer!


