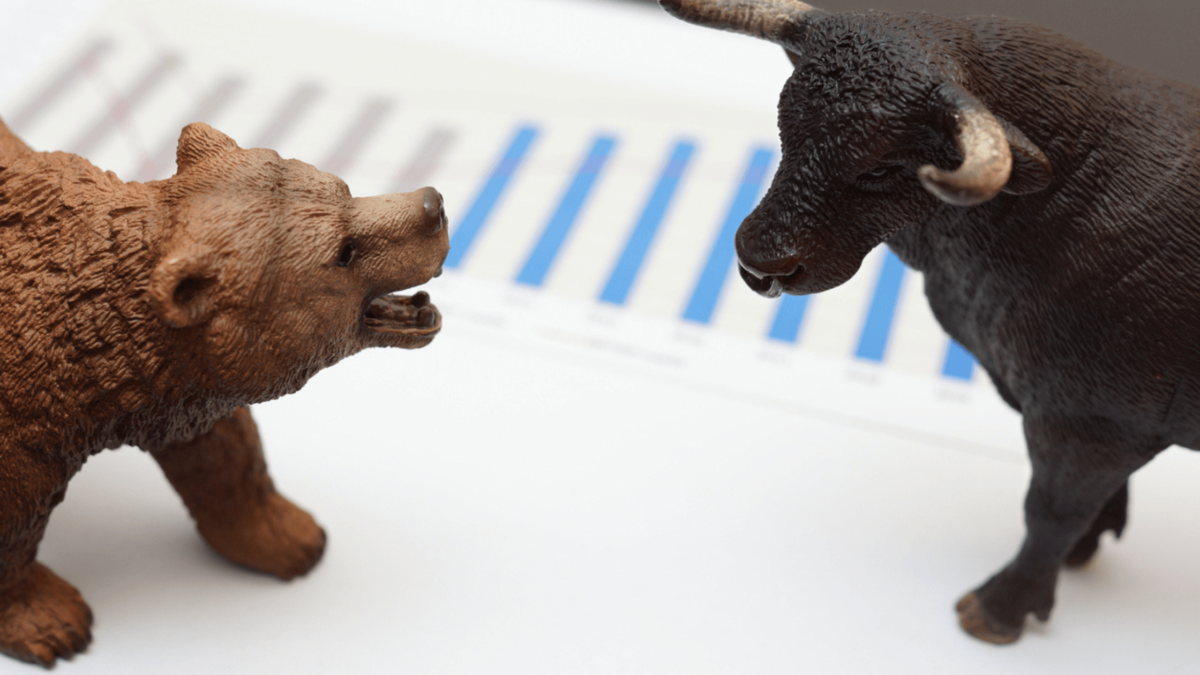
Technical rebound in US equities continues.
The S&P 500’s bounce off the 3,820 technical support region accelerated last week, with the index gaining 6.6% last week. It is instructive that the index has been surging since hitting an intra-day low of 3,810 on 20th May. Meanwhile, the Nasdaq 100 gained 7.2% last week.
We had noted in the last edition of Big Money that 3,820 on the S&P 500 approximates the convergence of the price objective of the “head and shoulders” pattern from December 21 toJanuary 22 and the 38.2% retracement of the move from March 2020 to January 2022. That is, it is a significant technical support zone.
In our last Big Money, we also noted that sentiment could be supported by a recent decline in the 10Y UST yield and a modest easing in the market’s rates expectations. And this was exactly what happened last week.
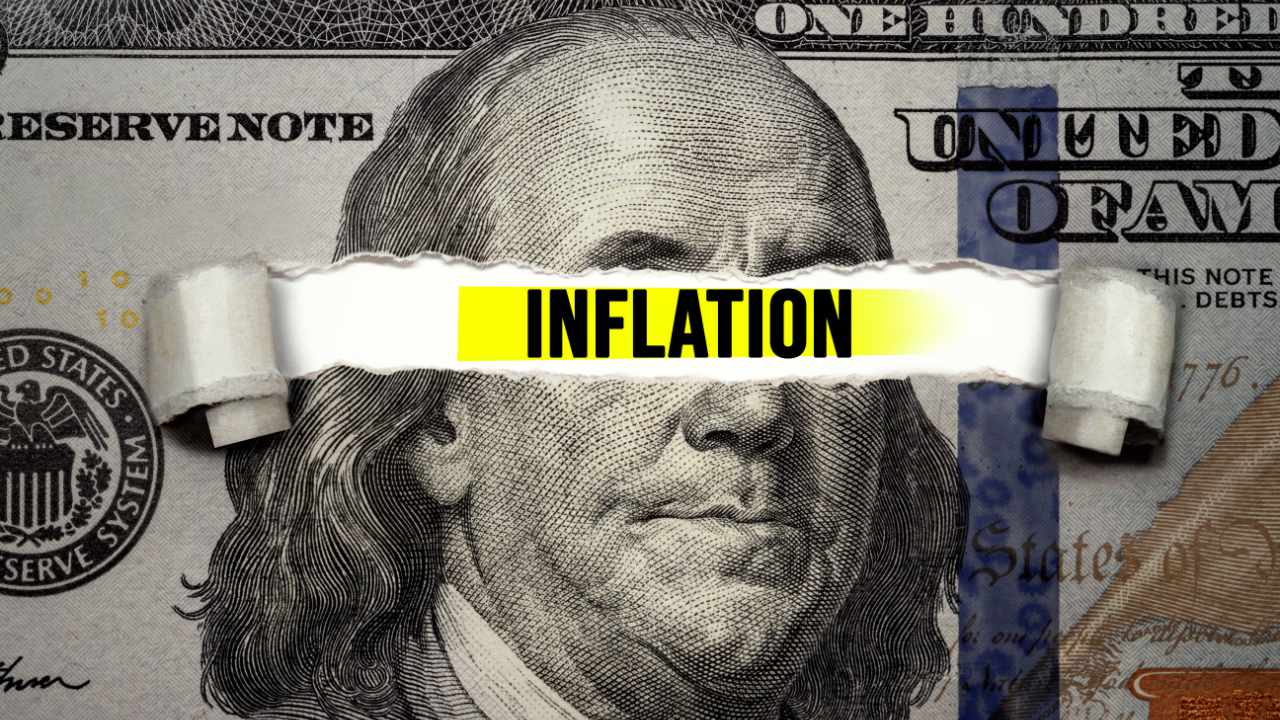
The bond market drives down its indicators of US inflation and rates expectations.
The 10Y UST yield edged down further from 2.78% to 2.74%, quite some way down from its early May peak of 3.2%. This is consistent with the easing of the 10-year breakeven inflation rate from its late April high of 3.02% to 2.63% by end of last week. Mirroring that move, the 5-year forward inflation expectation rate fell from 2.67% to 2.31% over the same time frame.
The Fed Funds Futures market pricing of rates probabilities turned in favour of more dovish outcomes by year end.
The more dovish bet on a year-end Fed Funds target rate in the range of 2.50%-2.75% saw its probability priced up from 34% Monday last week to 60% by end of the week. The more hawkish 2.75%-3.00% bet saw its probability priced down from 51% to 34%. The bets on the ultra-hawkish 3.00%-3.25% scenario faded from 14% to zero.
There was also moderation in the New York Federal Reserve’s inflation expectations survey, which showed 1-year ahead inflation expectation eased from 6.6% in March to 6.3% in April. That led to hopes that wages growth will continue to moderate. This is early days still but the year-on-year growth in average weekly earnings has eased from 5.5% in February to 4.6% in April.
Those expectations were given credence by the easing in the PCE inflation rates.
The data out last week showed US PCE inflation had eased from 6.6% year-on-year in March to 6.3% year-on-year in April. Core PCE inflation eased from 5.2% year-on-year in March to 4.9% year-on-year for April. This is still 290 basis points higher than the Fed’s target core PCE inflation rate of 2.0%. However, in a risk asset market where sentiment had shifted off technically oversold conditions, it may be good enough to sustain the rally for a few more weeks.
The 10Y UST yield is now poised at a technical support – a break below this could see a further, significant decline in coming weeks.
The 10Y UST yield is now poised just above the 2.7% support, which appears to be – in technical analysis terms – the so-called “neckline” of a “head and shoulders pattern” from early April. A break below that “neckline” could see a further significant decline. And with that, we could see a further easing in the US Dollar Index DXY which had been declining since mid-May, coinciding with the near-term bottoming of the S&P 500 index. This also suggests the possibility of further gains in the S&P 500 over the near-term.
But the battle against Developed Market inflation is far from over.
A 1-2 month easing of US inflation rates (one month for all items PCE inflation and two months for core PCE inflation) does not suggest the worst is over for Developed Market risk assets. Note that although US core PCE eased over the past two months on a year-on-year basis, it continued at a steady rate of 0.3% on a month-on-month basis. Again, to note, core PCE is still at 290 basis points over where the Fed says it should be.
Meanwhile, all items inflation will likely stay under upward pressure as crude oil prices pushed higher last week after trading sideways for the past two months. Brent crude – which had been capped at US$114/barrel since end-March – popped through resistance and closed at US$119 for the week.
Reminder: bounces at significant support zones eventually failing are quite common during bear markets.
There are some similarities in the rebound we are seeing in the S&P 500 and the price action in the early stages of the S&P 500 bear market in 2008. The rebound this time started off at 3,810, after a retreat of 21% from 4th January intra-day high to the 20th May intraday low. The rebound in March of 2008 came after a decline of 20% from the S&P 500 October 2007 intra-day high.
Something else to note is that in early 2008, the S&P 500 also rallied significantly at the 38.2% Fibonacci retracement of the entire bull market from late 2002 to late 2007 before moving much lower. The rebound from the 38.2% zone from mid-March 2008 lasted nearly two months and saw the index gain around 13%, below falling much lower.