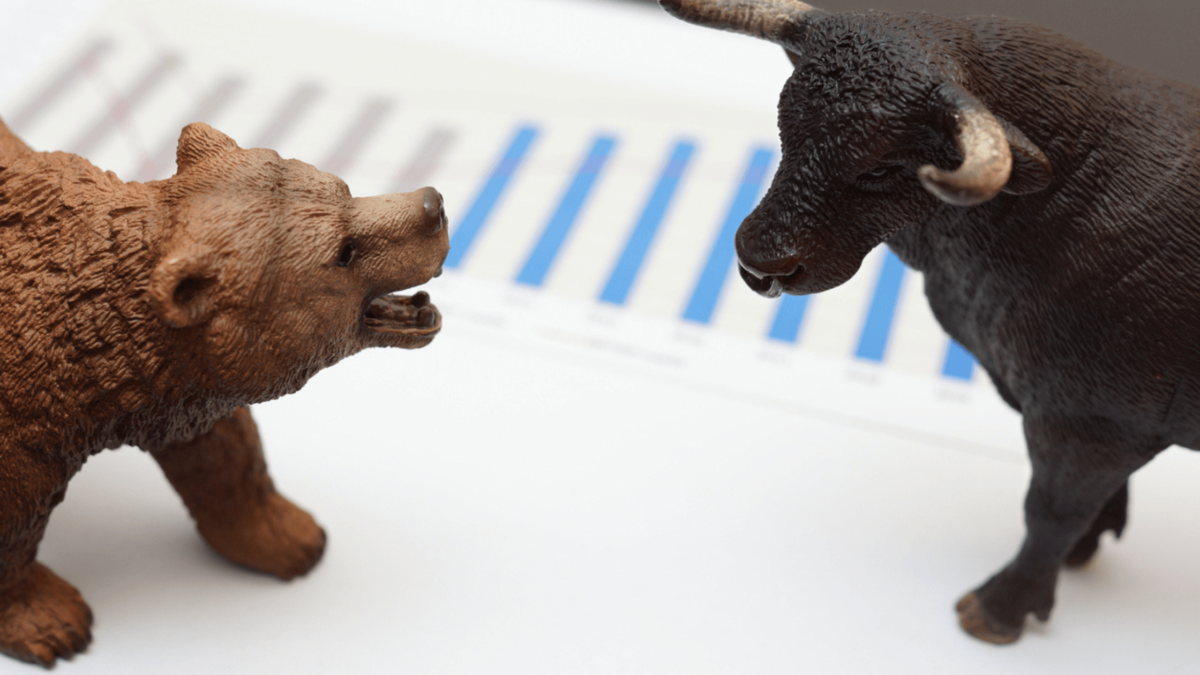
Let’s talk about stagflation
The market’s increasingly rapid mood swings between recession fear and inflation panic are not only confusing. They also miss an important point. We will get both a slowing economy and stubbornly high inflation for months to come. Inflation may come off a bit in July or August. But it will remain at multi decade highs. Rates will continue to go up. And Developed Market equities will continue to go down.
So, last week, the S&P 500 continued to grind lower on its downtrend channel, losing almost 1%.
There are time lags between demand destruction, which is underway, and sustained inflation suppression, which could be many months away
We had previously used the term the “VILE economy” (volatile inflation, low expansion economy) as an arguably less extreme version of “stagflation” – avoiding the suggestion of a long period of stasis. But the dynamics are the same. There are lags in the taming of inflation. That is, economic growth tends to come down faster than the rate of inflation. It usually requires quite a bit of policy tightening before inflation comes down. This has been observed repeatedly in 1955-1957; 1973-1975; 1979-1980; and 2000-2001. I don’t expect this time will be different for the US economy. Remember, this is not a trifling matter. US inflation data, released last week, takes us back to November 1981.
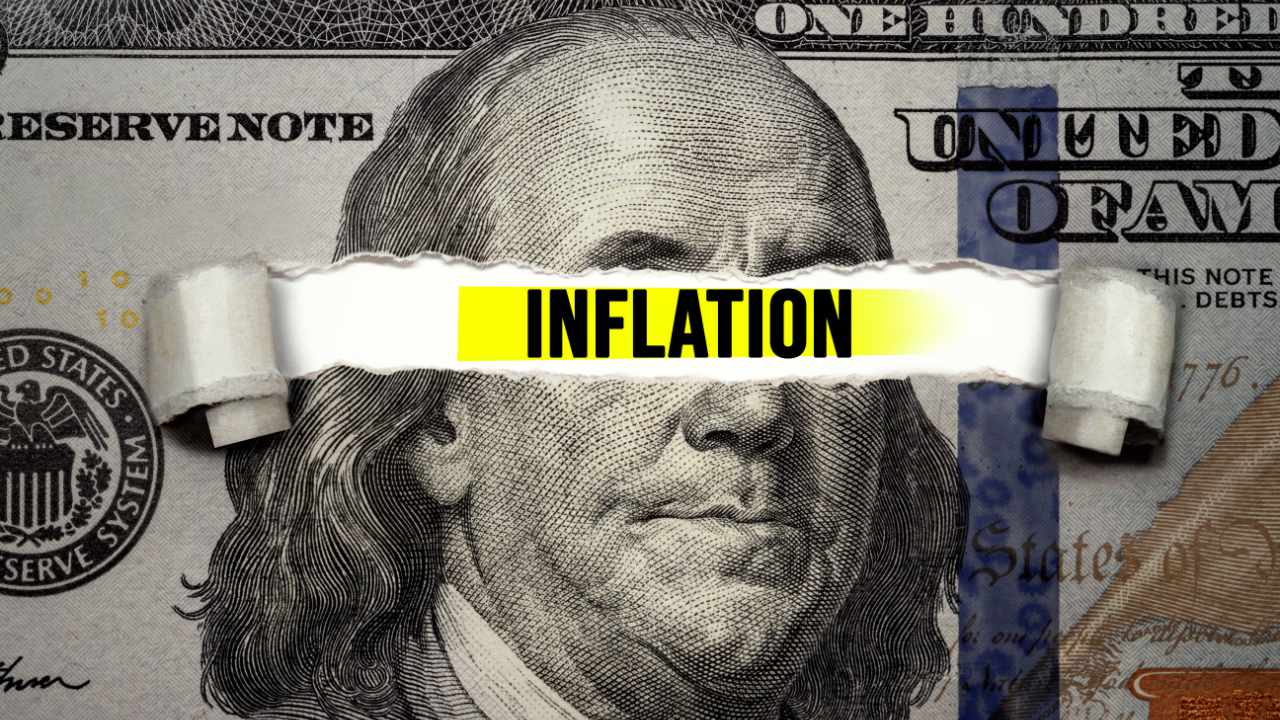
US inflation pushes higher
The keenly watched inflation data was another shocker, with the headline (all items) CPI up 9.1% y/y. This significantly exceeded the consensus estimate of 8.8%, and is a considerable surge from the May figure of 8.6% y/y. Producer price inflation for June also went higher to 11.3% y/y, from 10.9% y/y in May. So that was the inflation part of the stagflation malaise. Next came the stagnation part.
Real retail sales contracts again
But at the same time, June real (that is, inflation adjusted) retail sales remained in contraction in sequential terms, declining by 0.3% m/m in June. It was not as bad as the 1.1% m/m contraction in May, but it adds to the downside pressure on GDP growth for 2Q22.
It is also worth noting that positive media reports of 1.0% m/m growth in retail sales in June, up from contraction of 0.3% in May, was in nominal prices. That was in a month when inflation was up 1.3% m/m, seasonally adjusted. And of course, a lot of that went into spending at gasoline stations, which was up 4.7% m/m, and almost 50.0% y/y. So that’s not the figure you should be looking at for real GDP growth.
US consumer sentiment bounces a bit off a record low
And if consumer sentiment stays at current levels, there is little prospect of a significant reversal in real retail sales either in coming months. The University of Michigan’s Consumer Sentiment Index ticked up to 51.1 in its July survey, from 50.0 in June (revised down from the preliminary reading of 50.2). But these are still extremely depressed levels, with only the June reading showing a lower level in the series’ 34-year history.
Borderline recessionary but not yet
Industrial production fell into contraction, coming in at -0.2% m/m in June, continuing the weakening trend from zero growth for May.
And with all of that, the Atlanta Fed’s GDPNow model’s forecast for 2Q22 GDP growth rate fell to -1.5% by the end of last week from -1.2% a week ago.
We remain of the view that the US is not in recession yet, but that it will likely be in a recession in 6 to 12 months from now as demand destruction continues. US GDP growth is slowing very significantly. But it would likely narrowly avoid contraction on a quarter-on quarter basis in 2Q22, hence avoiding two consecutive quarters of negative growth.
But even if it did fall marginally into contraction in 2Q22, the National Bureau of Economic Research, which dates business cycles in the US, is unlikely to call a recession yet, given the robust jobs market and the likely shallowness of the contraction.
Meanwhile, markets may bounce around a bit on speculation of recession and inflation. But it seems only a matter of timing before both take their turns at pushing risk asset prices lower.
Update on Chinese equities
The CSI 300 is returning to test its 100-day moving average support. The 100-day moving average is an important level on the rise and also on the decline. Watch this closely this week. On a positive note, China’s financing conditions have been improving since April, and this is best captured by the all-system financing aggregate, which has been on the rise over the past 2-3 months. The market will want to see this rise continue. Finally, a note on China tech. Last month, I said the CSI Overseas China Internet Index still had the challenge of breaking out of the 4000-5500 trading range. It has yet to approach 5500 but had already fallen back. So it is still trapped in the range.
Disclaimer: CGS- CIMB Securities Chief Investment Strategist Say Boon Lim doesn’t own shares in any companies mentioned.